Creating Splunk Cloud Architecture Diagrams Using Lucidchart
By Kamal Dorairaj, Senior Splunk Consultant
Knowledge is valuable, and in the case of the Splunk installation at your firm a visual representation of the platform configuration becomes a key asset. The diagram gives better understanding of the Splunk Cloud Implementation and is useful for internal training as well as documentation needs at your company. In this blog, we will offer a step by step process for creating a Splunk cloud architecture diagram using Lucidchart.
The architecture diagram is best created in Lucidchart, which has all Splunk shapes, icons and images. It also has a library of shapes for all of the leading products you may be using, like AWS, Google Cloud Platform (GCP), Azure and other security products. You can also import shapes from external sources and use it for the diagram. Lucidchart provides options to export the diagram in various formats including pdf, Visio, jpeg, png and csv.
Discovery
In the discovery phase you will gather all the information required for the architecture diagram. Ask yourself these questions to ensure you include the essential materials:
• Which Splunk systems are being used in the environment? Examples include UF, HF, DS, etc.
• Where do the UFs forward to? Heavy Forwarders, Indexers, or a mix?
• What kind of data collection is taking place? Ex: Syslog, HEC, API.
• What is the list of data sources per HF? This will include the vendor/product lists.
• Which host has what type of Apps/Data collection?
• What are the IP, host name, cpu/memory/disk spaces of each HF/UF/DS?
• Are you using Splunk Premium Products in addition to Splunk Enterprise? These might include enterprise security, UBA or ITSI.
Diagram Creation Process
The diagram should be closely associated to the Splunk Validated Architecture based on the environment.
Architecture Layers
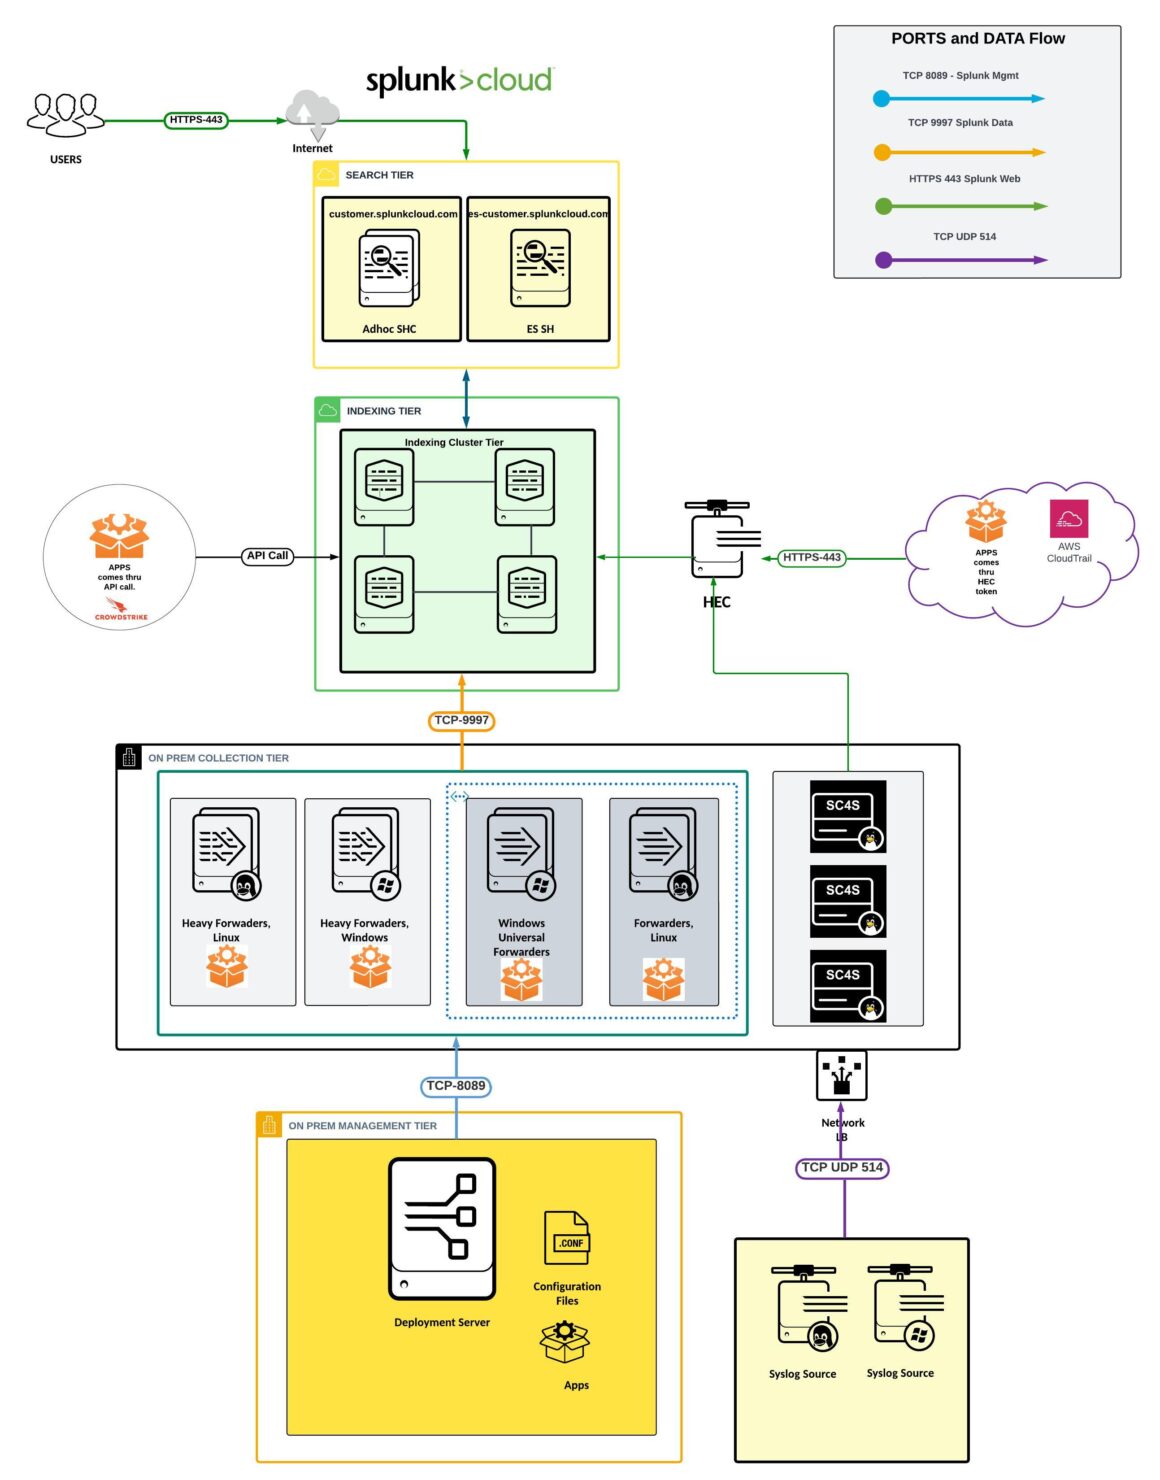
Login: Users access Splunk Cloud Search Head through ‘https 443’ via the internet.
Splunk Cloud Search Head Tier and Indexing Tier: The Search Head on the cloud got an Adhoc SH (customer.splunkcloud.com) and SH for the premium product if there is one. Ex: ES SH (escustomer.splunkcloud.com). The SH on the Cloud talks to the Indexing Cluster Tier through port 8089. Splunk does not allow to put any indexers or search head host details in the diagram.
Getting Data thru HEC and API: Apps or data that send through HEC (http event collector) token-based to Splunk Cloud Platform is a fast and efficient way. The HEC data flows to Splunk Cloud through port ‘https 443’. Getting Data in through APIs to Splunk Indexing layer by configuring the API inputs through an authentication type.
On-Prem Collection Tier: This part of the architecture lives on the customer network side. We have Heavy Forwarder and Universal Forwarder. The instances could be on unix or windows. Both the HFs and UFs forward the data to the Splunk Indexing tier thru port ‘TCP 9997”.
On-Prem Management Tier: The DS has all the apps and config files which pushes the changes thru ‘TCP 8089” to the HFs and UFs. Many times, the license master is installed in the same DS server instances.
Syslog Sources: There could be single or multiple syslog sources that send data thru ‘TCP UDP 514’ in a network load balancer to the UFs or HFs. The syslog can also configure to flows thru SC4S.
PORT Details:
TCP 8089 -> Splunk Management Port
TCP 9997 -> Splunk Data
HTTPS 443 -> Splunk Web
TCP UDP 514 -> Syslog
TCP 8191 -> KV Store Replication
TCP 9777 -> SHC Replication
TCP 9887 -> IDX Replication
This is what a typical Splunk cloud architecture diagram will look like:

Have fun creating diagrams of your own. As always, we are here if you have any questions. Contact us here:


