ITSI Content Packs
By Tyler Phillips, Splunk Consultant
Lately, I have been delving into Splunk’s premium app ITSI. Splunk IT Service Intelligence is a KPI monitoring addition to Splunk, where we can use predictive analytics to see incidents before they happen and see the status of services that keep your company running smoothly. My colleague and I were working with a client and used content packs to get them started with ITSI.
ITSI uses metric data from all types of places and servers to show us how these servers are running and what could be going wrong at any time. There is an add-on for Linux that I will be using today to show what I am trying to do. We need to set up the add-on to pull in metric data and install the Splunk App for Content Packs to do this. Now we can get to the ITSI setup.
Let’s start with the basic ITSI Linux service. I installed the add-on and brought in the metrics data. I then went into ITSI Service Templates and created a service called Linux using the “OS KPIs – *nix (SAI)” Service Template. Now let’s look at this in the Service Analyzer.
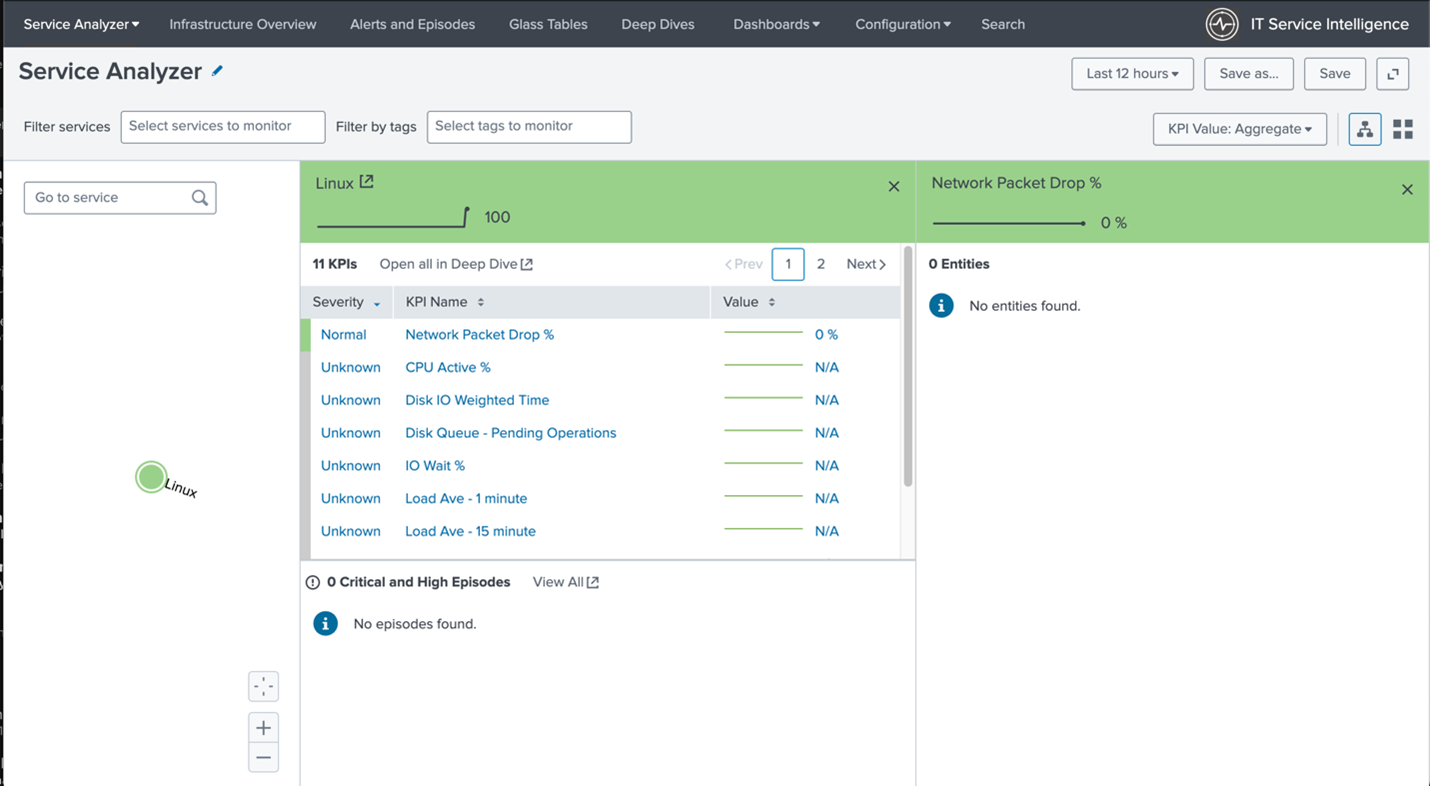
Notice how no fields are filled out other than packet drops. This is filled out with 0 because there is no data there. The default Linux service is receiving no data because it does not recognize the fields that are feeding it.
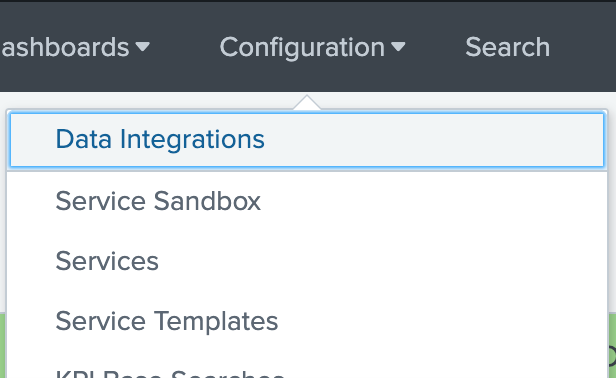
Now, let’s add the content pack “Monitoring Unix and Linux” to be able to read this data. Go to the Configuration tab and select Data Integrations.
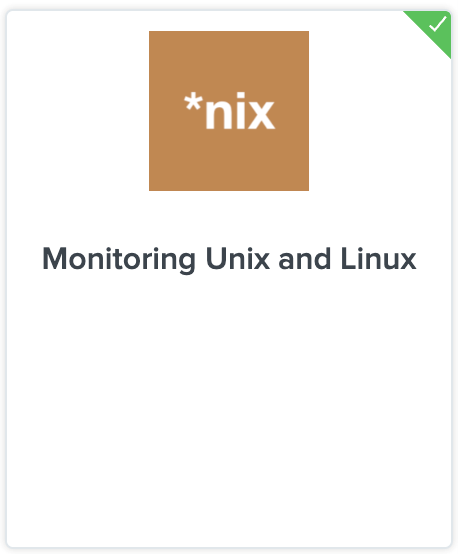
From here we can select the Content Library tab and find the “Monitoring Unix and Linux” content pack and select it. Then click proceed to install the content pack.
Once this is installed we can go back to the Service Templates page in the Configurations tab and see a new Service Template called “Unix and Linux server health”. Let’s create a service from this. Select the template and click the “New Service From Template”, then we can name the service. For my example, I named it “Linux – Content Pack”.
To get the service running let’s add an entity. Go to the service and select the Entities tab.
There will be an empty field in the two entity rules automatically set up. We need to add a host to search data for. I added my laptop to this to pull in its data. I’ll be showing the page without my laptop hostname.
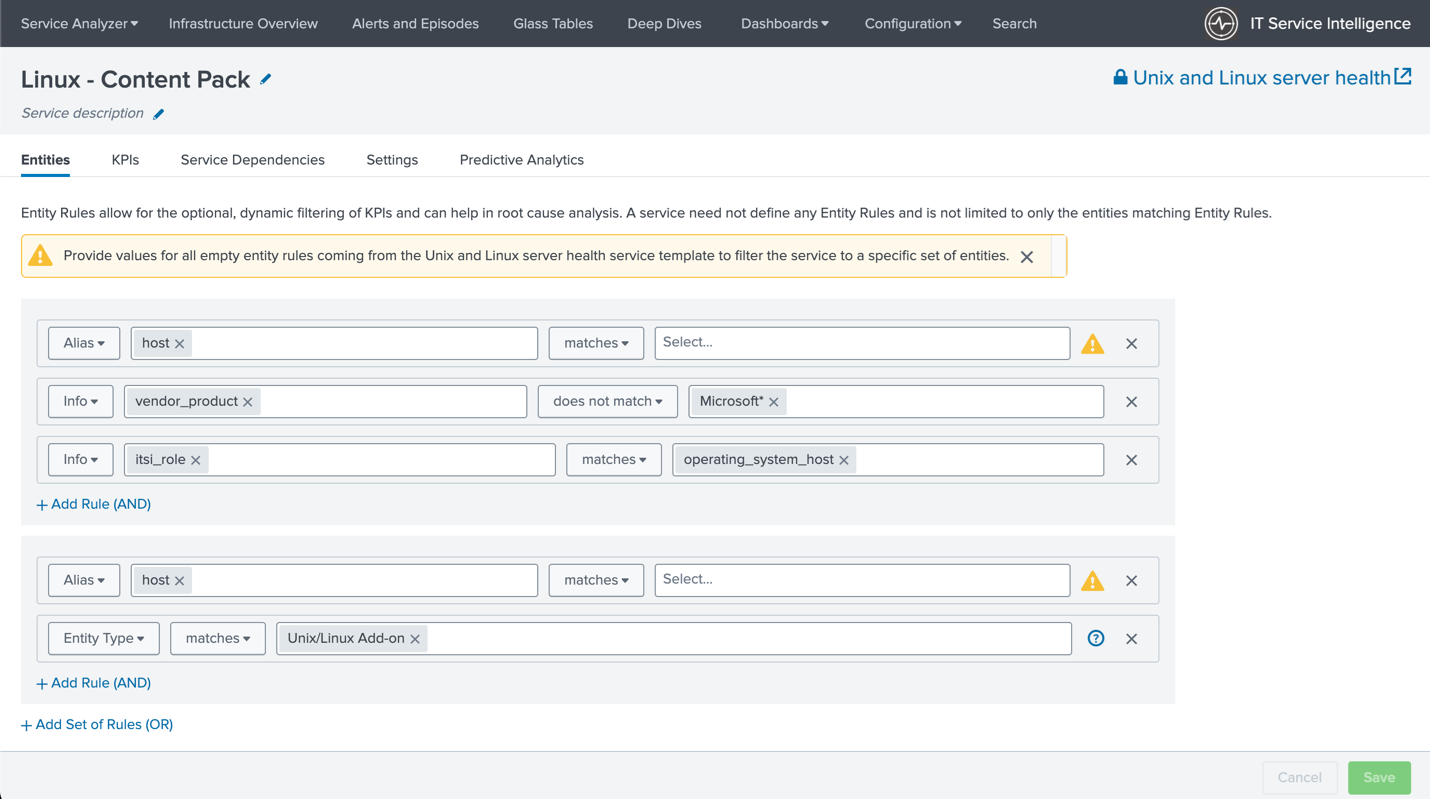
Once you have added your host click save and then continue to save and enable. Click that and boom! We should be good to go!
Let’s check the service analyzer to see the data coming in.
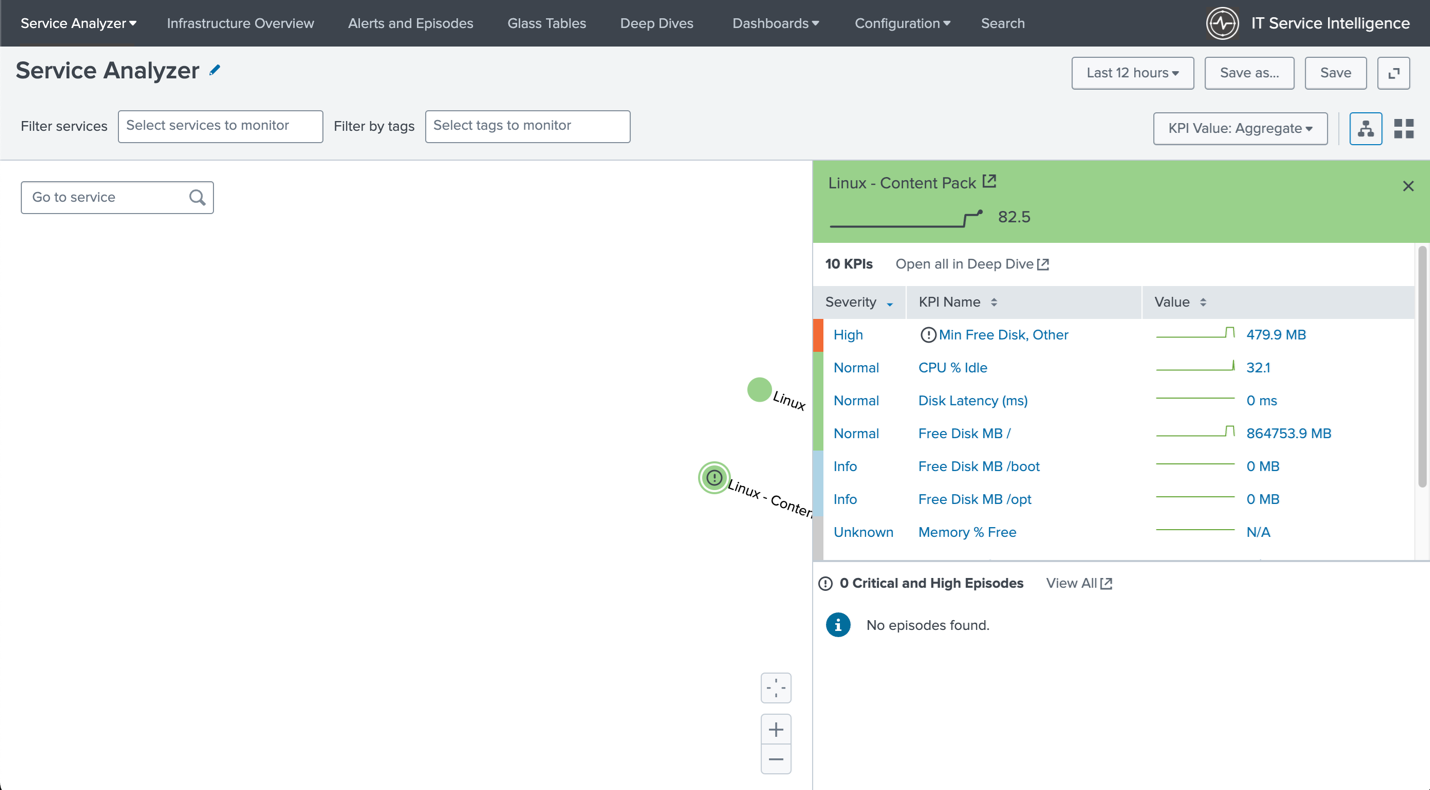
I had to wait a few minutes for the searches to run so seeing no results at first is fine. Just give it some time. This data also shows up on the Infrastructure Overview tab automatically. Let’s check it out.
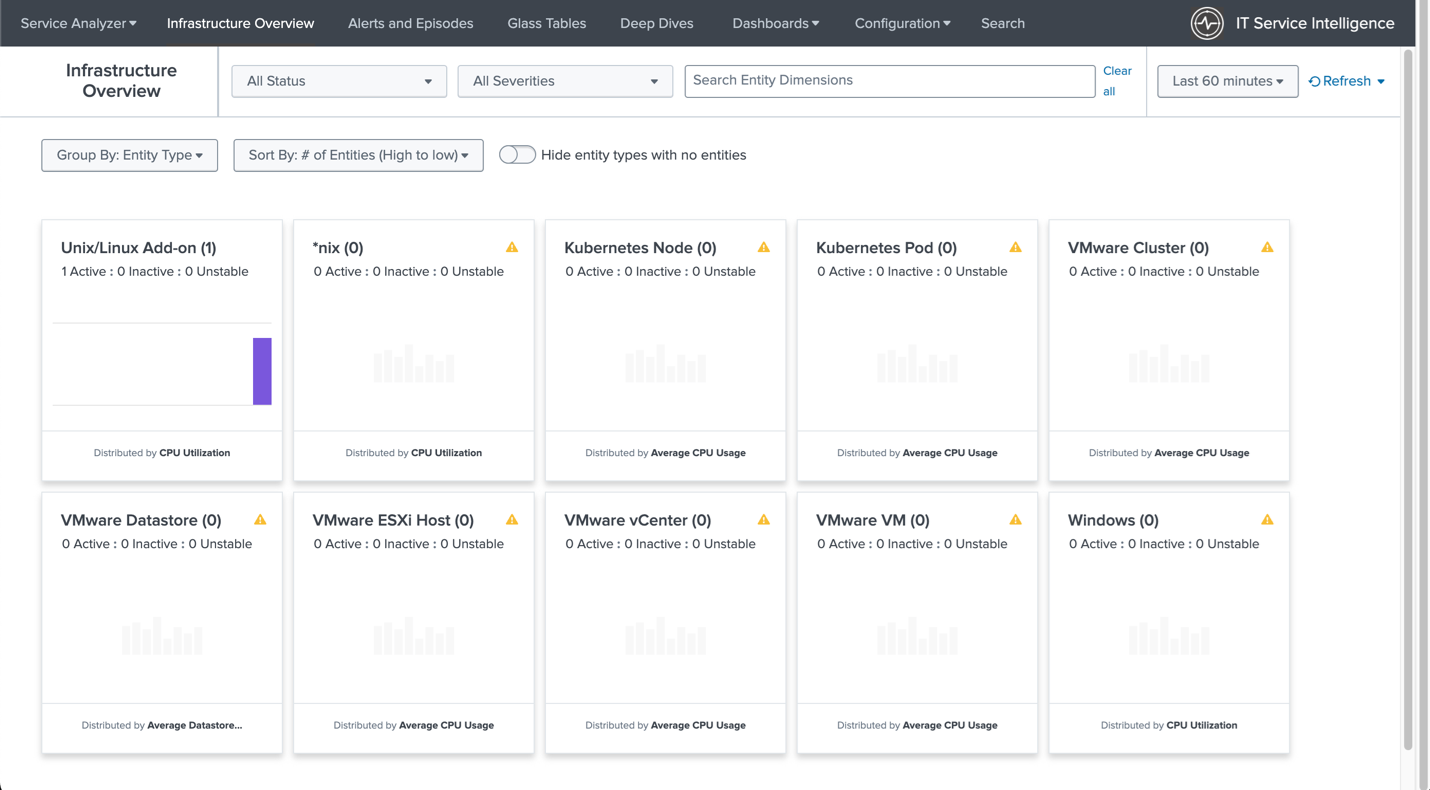
This process is how I got started on a client project and ultimately gave them the information they needed to monitor their business. Content packs are a great way to get started with ITSI and show immediate data before setting up the full service analyzer tree and any predictive analytics that make ITSI so great for companies! More information on the Splunk services we offer can be found on our Splunk Services page

