Unlock Observability: 3 Ways Splunk Observability Cloud Works with AWS to Improve Your Monitoring Capabilities
According to the numbers, there are over 1,000,000 active AWS customers. In fact, there is a good chance that, like Netflix, Facebook, and LinkedIn, you, too, are using Amazon Web Services to support all or a portion of your cloud-based platforms and systems. Cloud technologies like AWS provide a host of benefits including scalability, cost-efficiencies, and reliability. But the very nature of cloud processing also introduces new layers of complexity. One critical added complexity is in monitoring cloud systems to identify and resolve issues. Traditional alert monitoring tools were not designed to address the ephemeral nature of cloud processing.
Fortunately, Splunk has brought a full observability suite to market that integrates seamlessly with AWS’s portfolio of services to provide AWS users and their DevOps teams with the tools they need to improve the performance of their cloud-based systems. Below, we have laid out a brief primer on observability and paired that overview with three ways that the Splunk Observability Cloud works with AWS to streamline your monitoring.
Introduction to the Splunk Observability Cloud
While there is no shortage of observability tools on the market, Splunk’s acquisition of SignalFX in 2019, its subsequent additions to the platform, and its existing AWS integrations make it a powerful choice for organizations that use AWS as well as other leading cloud solutions like Microsoft Azure and Google Cloud Platform.
Splunk offers a fully integrated observability set of products designed to bring all metric, trace, and log telemetry into a single source of data truth. Additionally, you can seamlessly merge this data with other Splunk Enterprise data such as security, IT and DevOps for the most comprehensive and integrated view of your environment.
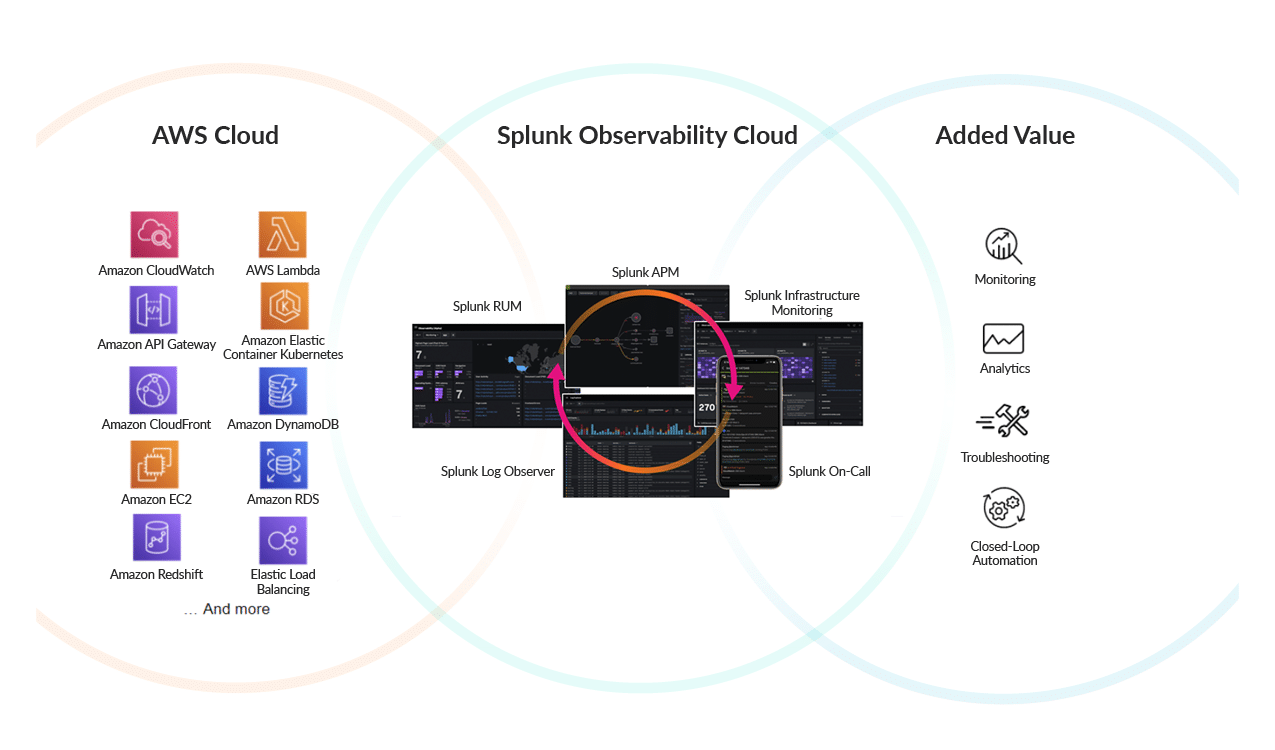
The Splunk Observability Cloud is comprised of several monitoring and observability products, including:
- – Splunk Infrastructure Monitoring: AI-driven infrastructure monitoring for hybrid or multi-cloud environments.
- – Splunk APM: NoSample™ full-fidelity application performance monitoring and AI-driven directed troubleshooting.
- – Splunk On-Call: Incident response and collaboration.
- – Splunk RUM (coming soon): Works with Splunk APM to provide end-to-end full-fidelity visibility by providing metrics about the actual user experience as seen from the browser.
- – Splunk Log Observer: Built specifically for SREs, DevOps engineers, and developers who need a logging experience that empowers their troubleshooting and debugging processes.
Three Benefits of Integrating Splunk Observability Cloud with AWS
For organizations already using AWS, Splunk works seamlessly with Amazon to provide DevOps teams with out-of-the-box visibility across their complete AWS environment. With Splunk Observability Cloud, all data is shown within a single system, making it easy for your team to identify issues across any of the AWS tools you utilize.
As data passes from your AWS services into your Splunk environment, it is analyzed in real time across the full Splunk Observability Cloud. The result is comprehensive reporting and monitoring that allows you to identify and respond to issues the moment they occur – regardless of your platform’s size.

While there are several efficiencies and benefits to be gained by layering Splunk Observability Cloud onto your AWS environment, here are three that stick out to our team:
1. Global Monitoring of Amazon Container Services
Splunk’s Infrastructure Monitoring tool (part of the Observability Cloud) is built to specifically monitor the ephemeral and dynamic nature of container environments. Through this tool, customers can have key insight into Amazon ECS and Amazon EKS performance characteristics and containerized applications.
Out-of-the box dashboards and reporting provide teams with the information they need to capture immediate value from the platform.
2. Real-time Fidelity Tracing
Are you tired of having to sample data or work with limiting data ingestion caps? Splunk Observability Cloud includes two powerful tools that, together with AWS, provide teams with end-to-end full-fidelity tracing.
First, Splunk APM utilizes OpenTelemetry-enabled instrumentation to ingest all trace data. No more sampling. Splunk APM captures, analyzes and stores 100% of available trace data. Once captured, Splunk Real User Monitoring (RUM) can tie that trace data to specific user actions within your AWS environment.
These systems work in tandem to provide your team with rich visibility into the bugs and bottlenecks that could harm your user experience.
3. Automated Incident Response
Not only does Splunk Observability Cloud provide real-time visibility across your complete cloud stack, but it also can reduce your team’s mean time to recovery (MTTR) through automated responses. Through the platform, DevOps teams can set automated remediations that fire regardless of human oversight.
Built-in artificial intelligence and machine-learning capabilities help further improve the efficiency and latency of automated responses.
Enhance Your AWS Platform with Splunk Observability Cloud
If your legacy monitoring systems cannot keep up with the complexities and intricacies of AWS, it’s time to make a shift in your team’s mindset towards observability. By making the structural changes necessary to facilitate observability and embracing robust tools like Splunk Observability Cloud, your team will gain the capacity to improve the performance of your AWS environment.
Interested in learning more about observability and how Splunk Observability Cloud can help you monitor and improve your AWS platform? Download our latest eBook:


